Maps were and are indispensable in warfare. They are the blueprints of strategies and tactics for offense and defense.
In this day and age, civilization is facing a different kind of warfare – climate change. This phenomenon spares no one around the world. In the quest to defend people from the “enemy,” warfare arsenal maps were created using digital technology.
At UPLB, a team of young people representing various disciplines were brought together for this singular purpose – more specifically, to create maps that would help predict the occurrence and extent of flooding, and thus alert communities to flood occurrence.
The team was part of the Nationwide Hazard Mapping Using LiDAR (Phil-LiDAR Program 1) whose aim was to produce high resolution maps that would show the extent of flooding across major rivers in the country.
The UPLB Phil-LiDAR 1 Project was entrusted with a slice of the 1.5 billion-peso nationwide budget of the Program to produce accurate and detailed flood hazard maps of the provinces of Laguna, Oriental Mindoro, Occidental Mindoro, Marinduque, and Palawan. These maps show the river systems and the physical structures, such as houses and buildings, and how floods would reach the surrounding communities in the years to come.
According to Prof. Edwin R. Abucay, UPLB Phil-LiDAR 1 project leader and assistant professor at the Department of Community and Environmental Resources Planning of the College of Human Ecology, the existing topographic map of the Philippines still dates back to the United States colonial government. “It’s very old and much has already changed in the topographic features of the Philippines, even its riverine profile,” Prof. Abucay said, citing landslides as one of the reasons for these changes.
Taking off from a “DREAM”
The Phil-LiDAR 1 Program took off from the Disaster Risk and Exposure Assessment for Mitigation (DREAM) Program of the Department of Science and Technology (DOST). Based in UP Diliman, DREAM was implemented in 2012 to create hazard maps for 18 major river basins in the country. It also created a water level forecast service that informed people of the water level of different rivers during typhoons and heavy rains. DREAM collected data for the maps using aircrafts equipped with Light Detection and Ranging (LiDAR).
LiDAR works by sending out a laser beam from the aircraft, which scans and reflects the Earth’s surface and its features to a sensor. Introduced in 2012, LiDAR is fairly new in the Philippines – one of few countries in the ASEAN to have invested
in it.
The Phil-LiDAR 1 Project received a high resolution spatial data set from DREAM Program in the form of high resolution maps. One is a map showing data that includes objects and features, whereas the other map shows the surface data or bare Earth, which Prof. Abucay said, were used for flood hazard mapping.
Data processing and validation, and flood modeling
Three major activities – data processing, field validation and flood modeling – comprised the project. Data processing involved the use of specialized software to convert the DREAM topographic maps into maps that show the rivers, the open spaces and the structures around them. The team edited and corrected the map that bore a digital model of a 3D representation of the terrain’s surface to ensure that the topography of and the physical structures within the river basins that were captured by LiDAR are correct.
Then the team progressed to what was probably the most difficult part – field validation of the information on the map with what is found on the ground. According to Prof. Abucay, they deployed project team members to provinces to collect river flow measurements, bridge cross sections, rainfall data, land cover, soil types, and other relevant data used in the calibration of flood hazard maps. The team scaled mountains, forded rivers, and braved harsh elements to validate information on the map with what it found on the ground.
By conducting river flow measurements, the project team was able to record the actual flow of water in the river on a normal day (base flow) and during extreme rainfall event (event flow). This gave them concrete information used to project the extent of floods during typhoons and heavy rainfall. This data was also compared with information on flooding that the team obtained through interviews. The team used Global Positioning System to collect highly accurate positional data of various features that they studied.
Flood modeling then came next.
By using the processed and validated data, the team was able to project how the rivers would behave in case of extreme heavy rainfall and flooding. Through fieldwork, they observed the depth and range of flooding and reviewed rainfall data through the years. The flood projections were modeled in various maps that show how flooding would most likely occur in any area.
Useful Map Features
One of the useful features of the flood hazard maps of Phil-LiDAR 1 Project are the projections on the probable extent of flooding within 5, 10, 25, 50, and 100 years. Prof. Abucay said that in the projected flooding in the next 100 years, the coverage of flood is the widest. While the principle is that it could happen in a probability of 1/100, he said that such scenario has taken place during typhoon Ondoy in 2009, and similar events keep on happening.
The project team aimed at coming up with accurate one-direction and one-dimension flood hazard maps of the river basins in assigned provinces. These maps will be useful for mitigating disaster risks, land use planning, and implementing adaptation measures such as designing drainage systems and retrofitting buildings.
The UPLB Phil-LiDAR 1 Project also developed a web-based flood management information system. Prof. Abucay said that this output is envisioned to provide flood forecast with six hours lead time to enable evacuation during the occurrence of typhoons and heavy rainfall.
Turning over the maps to communities
Natural disasters have been happening with increasing frequency, demanding urgency for the project to come up with the flood hazard maps which would be useful in local development planning, as well. “At the end of the day, it is the community that would benefit from these maps,” said Prof. Abucay. “Printed maps will be turned over to the provincial, municipal and barangay local government units (LGUs),” he added.
Aside from LGUs, the project also intends to provide concerned national government agencies and non-government organizations copies of the maps.
Prof. Abucay said that they are also looking at other research projects that would use the existing data and equipment from the Phil-LiDAR 1 Project. They are looking forward to making a proposal to assess the areas where excess water from floods would be stored to make natural dams or ponds; that is after fulfilling their original goal – making maps that will save lives.
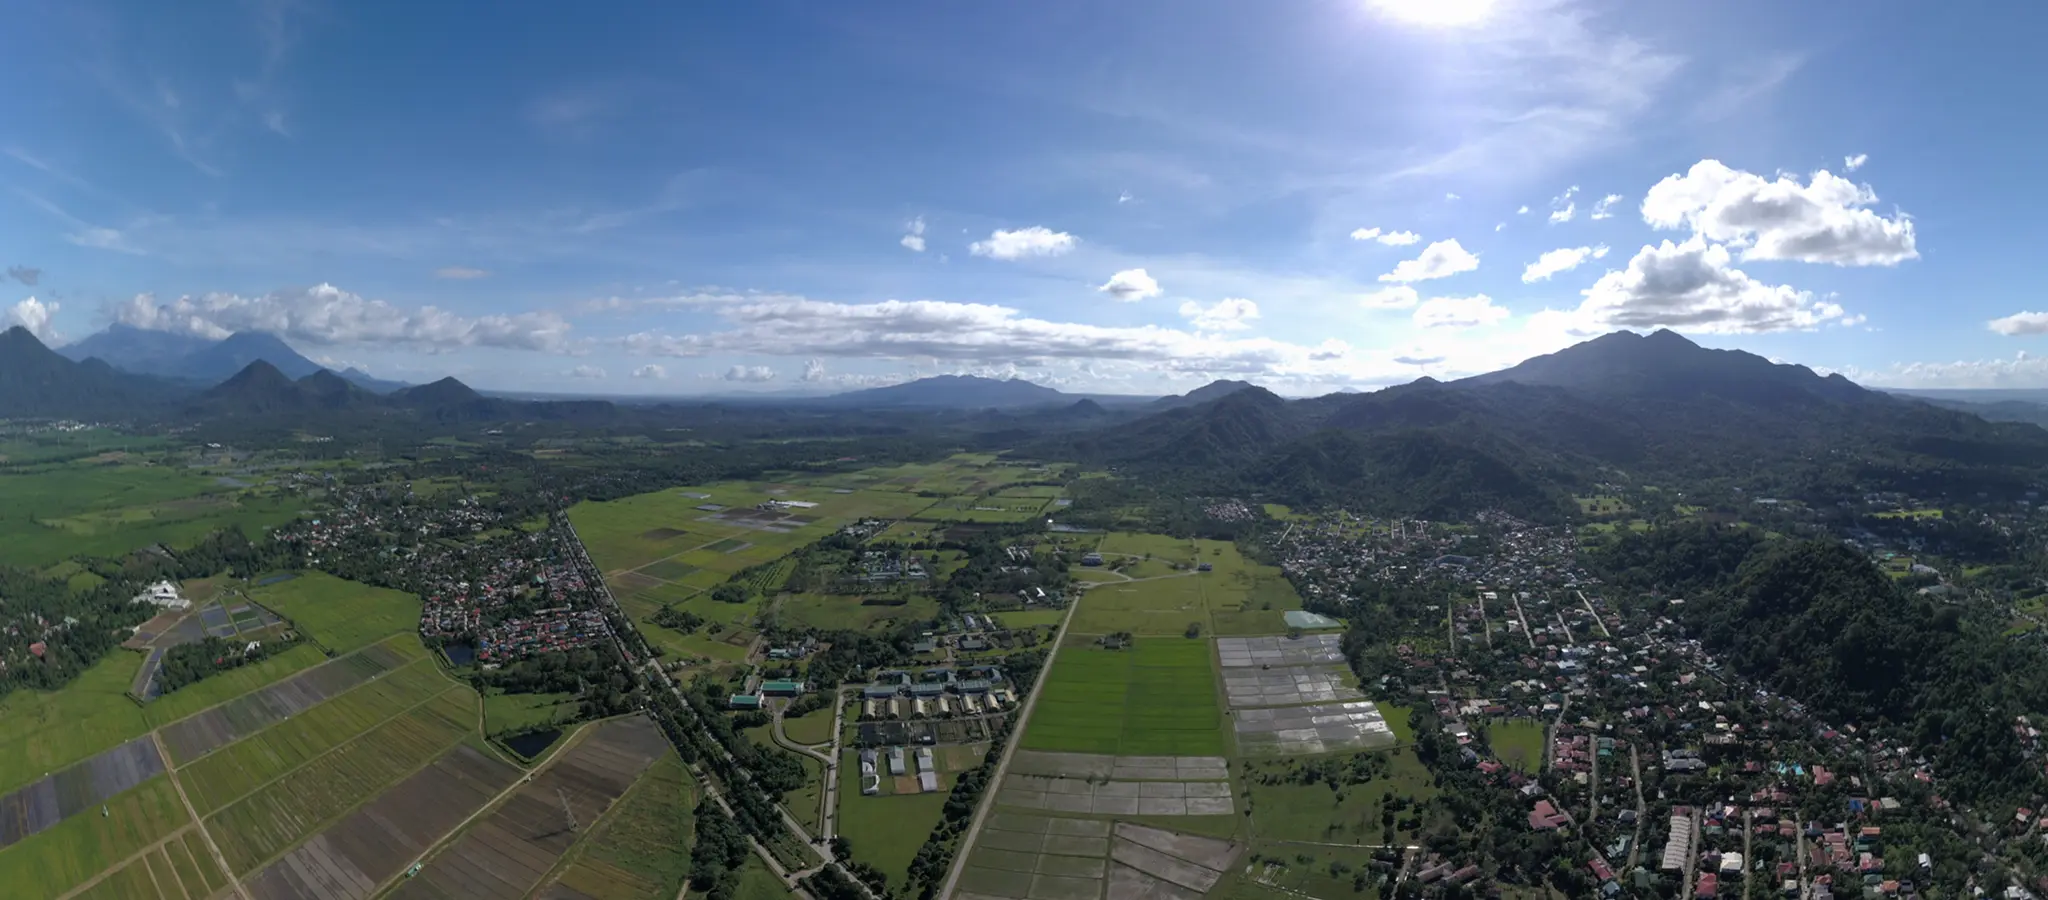
Photo from the UPLB Phil-LIDAR 1 Project
Share this on: